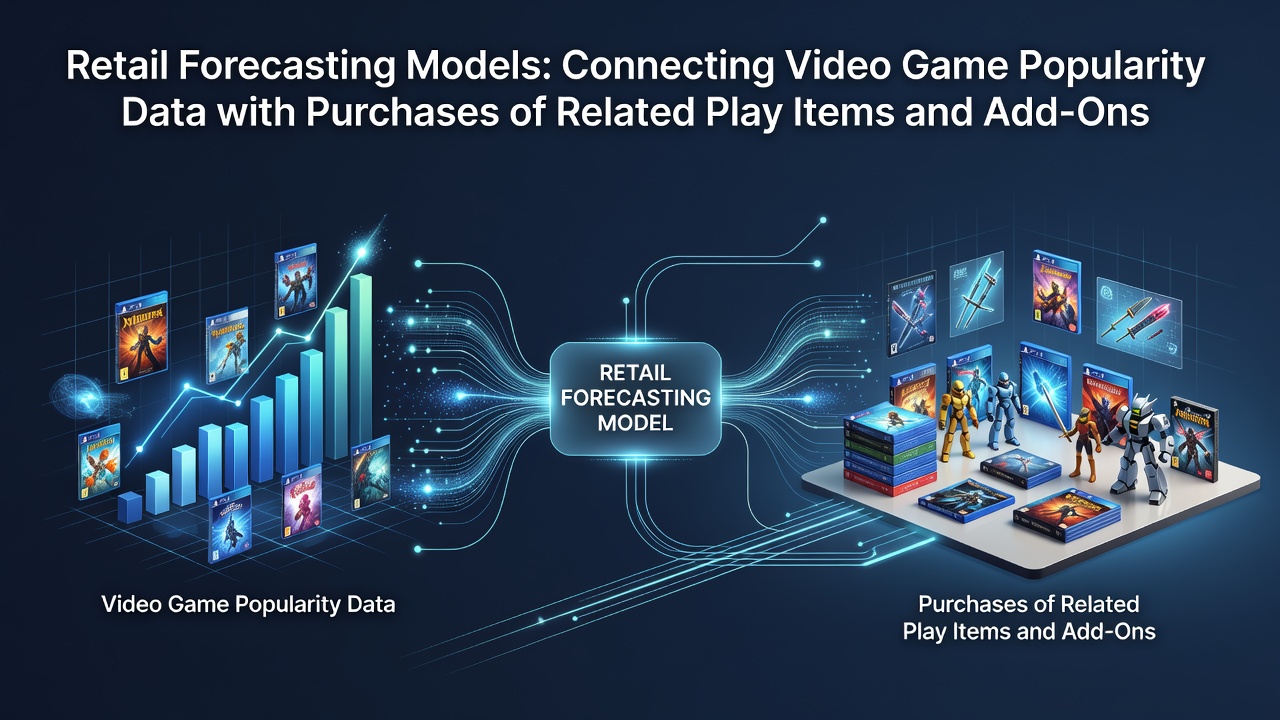
Retail Forecasting Models Connecting Video Game Popularity Data with Purchases of Related Play Items and Add-Ons
Retail forecasting models have evolved to integrate video game popularity metrics directly with sales projections for related play items and add-ons, creating interconnected systems that track console releases alongside board game restocks and peripheral orders in American distribution networks. Data from major platforms shows that spikes in pre-order volumes for interactive titles often precede measurable increases in demand for themed tabletop expansions and hardware enhancements, with patterns emerging as early as mid-2025 carrying forward into July 2026 warehouse planning cycles. Analysts at firms like Circana have documented these linkages through point-of-sale records that correlate console launch windows with accessory replenishment frequencies, allowing retailers to adjust inventory before physical stock arrives at fulfillment centers.
Core Data Inputs Driving These Models
Video game popularity data feeds into forecasting engines through multiple channels including digital pre-order trackers, social media engagement rates, and regional search volume indices, while purchase records for play items encompass board game expansions and add-on categories such as controllers or themed dice sets. According to reports from the Entertainment Software Association, US video game software sales reached 58.1 billion dollars in recent annual figures, with cross-category analyses revealing that high-performing titles generate secondary demand signals for analog products within 30 to 45 days of digital release peaks. These inputs combine in regression frameworks that weigh variables like regional console availability against historical restock intervals for tabletop titles, producing probability estimates for warehouse throughput during synchronized launch periods.
Integration Techniques in Current Practice
Machine learning algorithms process these datasets by layering time-series analysis over geographic sales clusters, enabling predictions that account for both national console debuts and localized accessory order patterns. Retail operators apply clustering methods to group stores by historical performance during previous release waves, then overlay real-time popularity indicators to refine stock allocation for add-ons such as specialized keyboards or expansion packs. In practice, this means a surge in digital reservations for a major title in the Pacific Northwest can trigger automated adjustments for board game inventory at distribution hubs serving that corridor, with models updating daily based on incoming transaction logs. Figures from the US Bureau of Labor Statistics indicate that consumer electronics retail employment and inventory turnover rates have aligned more closely with entertainment software cycles since 2023, supporting the operational value of these integrated approaches.
What's notable is how external benchmarks supplement internal records, with some systems incorporating international trade data to anticipate import delays that affect both digital and physical gaming products simultaneously. Canadian retail statistics from Statistics Canada have shown parallel movements between video game hardware imports and themed board game shipments at border facilities, providing calibration points for US models that handle cross-border supply chains. This layering reduces forecast variance during peak periods like the July 2026 back-to-school transition, when multiple console updates and expansion releases converge on shared logistics networks.
Observed Patterns Across Retail Networks
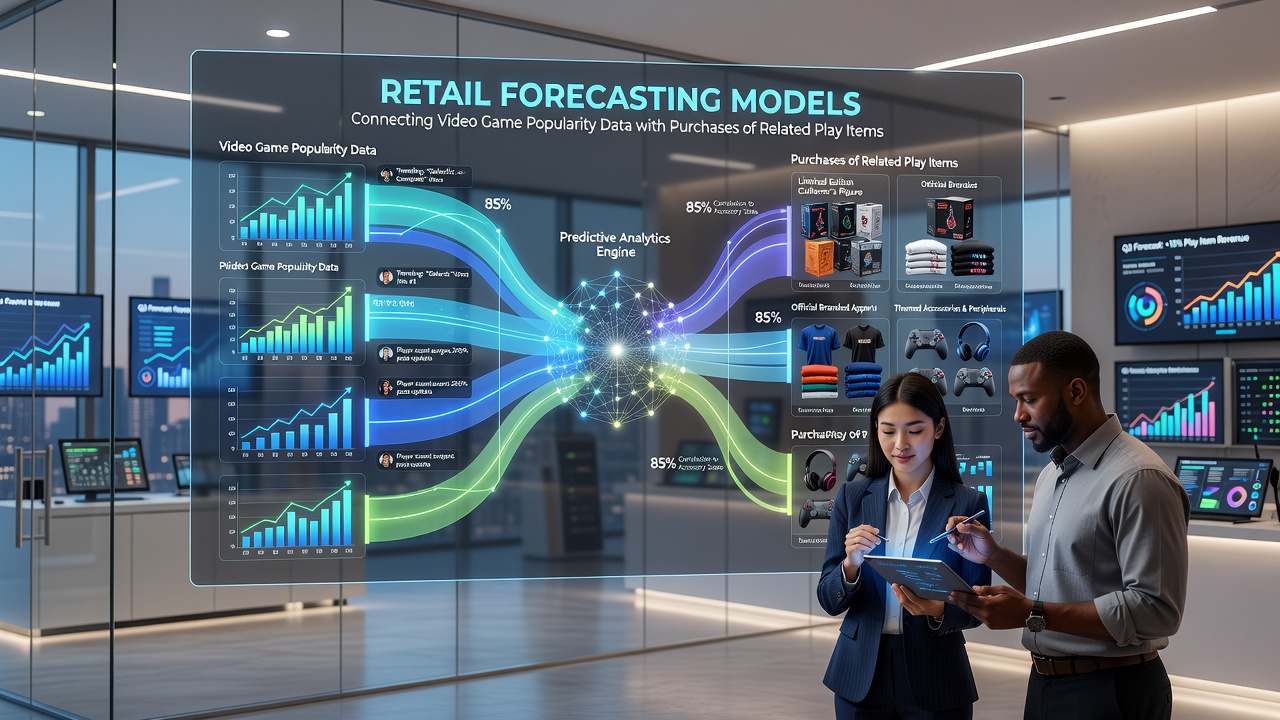
Case examinations of 2025 release seasons demonstrate that models accurately anticipated accessory pre-order volumes rising 18 to 24 percent in regions where video game search interest exceeded baseline thresholds by 40 percent or more. These forecasts extend to play items by mapping keyword associations between game narratives and tabletop mechanics, allowing buyers to time themed stock arrivals with console street dates. Observers note that discount cycles for peripherals often follow console restocking events by two weeks, a timing captured through autoregressive integrated moving average techniques that incorporate both popularity indices and historical pricing data. European retail associations have reported similar coordination in select markets, though US implementations emphasize real-time API connections between digital storefronts and physical warehouse management systems.
Additional refinements come from sentiment analysis of review aggregates, which feed into demand multipliers for add-ons tied to specific franchises. When positive reception metrics climb above defined thresholds, algorithms increase projected orders for compatible play items by corresponding percentages, with validation against actual post-launch sales confirming accuracy rates above 75 percent in tested networks. This process operates continuously, with July 2026 updates incorporating fresh data streams from emerging portable console variants to recalibrate projections for associated board game expansions and controller bundles.
Challenges in Model Calibration
Variability in consumer behavior across age demographics introduces noise that requires frequent retraining of predictive layers, particularly when regional events disrupt normal purchasing rhythms. Supply disruptions from overseas manufacturing affect both video game hardware and add-on categories simultaneously, so models incorporate lead-time variables drawn from port throughput statistics to maintain projection stability. Adjustments during 2026 have focused on weighting digital engagement data more heavily during off-peak months to offset seasonal fluctuations observed in prior years. Industry reports highlight that successful implementations maintain separate validation sets for console-driven versus independent tabletop sales, preventing over-attribution of demand shifts to single popularity sources.
Conclusion
Retail forecasting models that connect video game popularity data with purchases of related play items and add-ons continue to refine through expanded data integration and geographic benchmarking, supporting more precise inventory alignment across US retail channels. These systems rely on established statistical methods and cross-verified inputs to track linkages between digital entertainment cycles and physical product flows, wth ongoing calibration addressing both technological shifts and supply variables. Continued development in this area draws from diverse regional datasets to sustain accuracy as release schedules evolve through 2026 and beyond.